Relational Charades: Turning Movies into Tables

TL;DR: You can store and even process videos in DuckDB. In this post, we show you how.
“Your scientists were so preoccupied with whether they could,
they didn't stop to think if they should.”
Dr. Ian Malcolm, Jurassic Park (1993)
Here at team DuckDB, we love tables. Tables are a timeless elegant abstraction that precedes literature by about a thousand years. Relational tables specifically can represent any kind of information imaginable. But just because something can be done it is not always a great idea to do so. Can we build a rocket propelled by a nuclear chain reaction that irradiates the land it flies over? Yes. Should we? Probably not.
Disclaimer
Array-like data like images and videos are a textbook example of something that might not benefit from storing them in a database. While of course any binary data can be added to tables as BLOBs, there is not that much added value from it. Sure, it's harder to lose the image compared to the industry standard solution, storing a file name that points to the image. But there are not that many meaningful operations that can be done on BLOBs other than store and load. Without adding some overhyped AI tech, you can't even ask the database what the picture shows.
Array data also has its own world of highly specialized file formats and compression algorithms. Just think of the ubiquitous MPEG-4 standard to store movies. They are approximate (not exact, lossy) formats that are designed around human perception models, which is why they can avoid storing things people do not notice. They achieve impressive compression rates, with a two hour "Full" HD movie compressing to about 2 GB using MPEG-4.
Ignoring the Disclaimer
But what would it feel like to turn a movie into a table? (Very) deep down, a movie is just a series of fast-moving pictures ("frames"), typically at something around 25 frames per second. At that speed, our monkey-brain cannot distinguish the separate images any more and is fooled into thinking that we are watching smooth movement. Side note for the younger generations, a strip of pictures was the way we shipped around movies for more than 100 years.
So a series of pictures it is. Each picture can be further deconstructed into a two-dimensional array (a "matrix") of points, so-called "pixels". Every pixel in turn consists of three numbers, one each for the intensity of red, green and blue, or RGB for short. Note that we're ignoring the audio tracks in this post, but in principle it would work the exact same way, just with a different kind of intensity.
As an added complexity, the relational model (famously) does not require an absolute order of records. So all the various offsets have to be made explicit to not lose information. This of course greatly increases the size of our data set. We end up with a table that looks like this:
| i | y | x | r | g | b |
|---|---|---|---|---|---|
| 0 | 0 | 0 | 4 | 5 | 1 |
| 0 | 0 | 1 | 4 | 5 | 1 |
| 0 | 0 | 2 | 5 | 6 | 2 |
| 0 | 0 | 3 | 8 | 9 | 4 |
| 0 | 0 | 4 | 9 | 10 | 5 |
| 0 | 0 | 5 | 11 | 12 | 8 |
| 0 | 0 | 6 | 11 | 12 | 8 |
| 0 | 0 | 7 | 11 | 12 | 8 |
| 0 | 0 | 8 | 9 | 10 | 5 |
| 0 | 0 | 9 | 9 | 10 | 5 |
We have the time offset or frame number i, we have x and y for the pixel position in the frame, and r, g and b for the color components red, green and blue. Quite involved.
But now the movie is just a single table. If only just we had a conventional and guaranteed total order of rows, we could in theory skip all columns except for r, g and b, because with a known resolution all other columns can be inferred. This is coincidentally also how actual movie data files are stored, ignoring compression. This is another reason why maybe relational tables are not the best place for a movie to live in, but if all you have is a hammer. We could also have used some more modern features of SQL and use nested fields (a LIST in DuckDB), but let's keep it to a table even System R could have dealt with. In addition, having explicit offsets does not require nebulous conventions or additional metadata to know along with axis order the array data was serialized.
Experiments
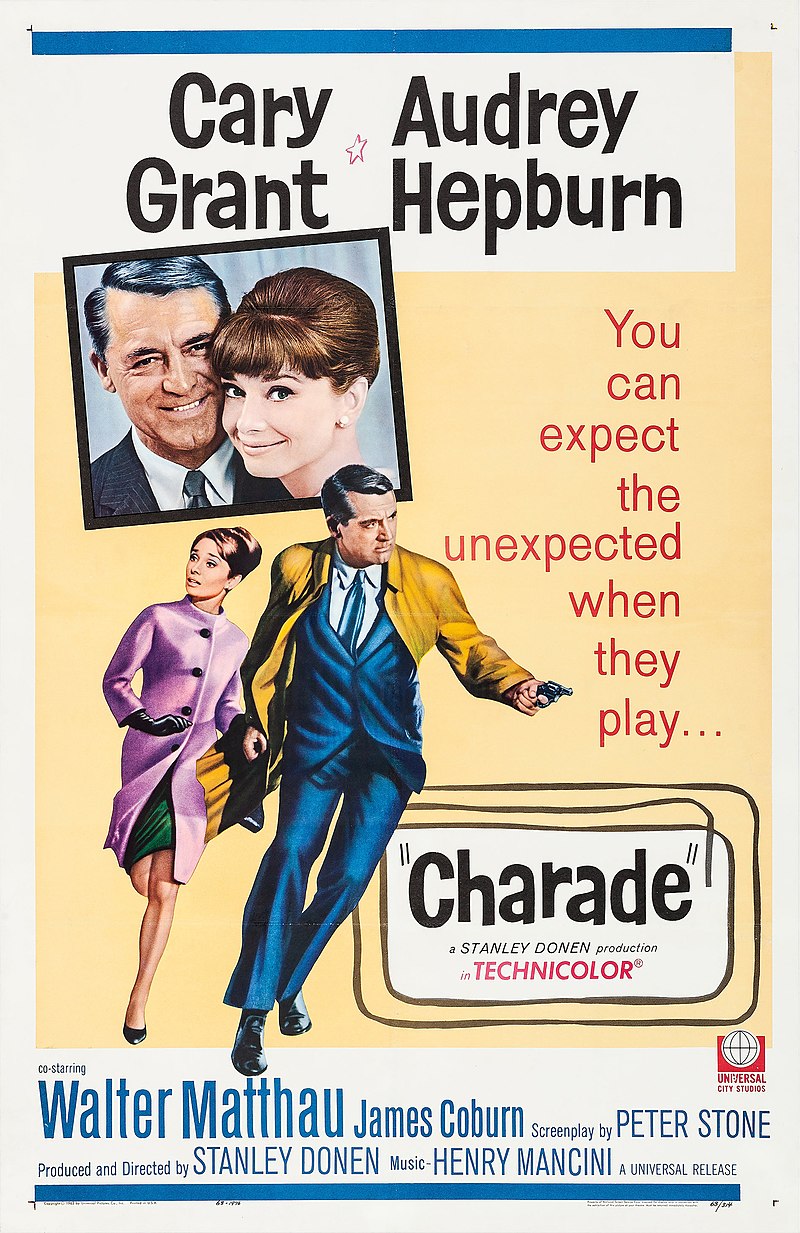
To investigate this daft idea further (for Science!), we convert the 1963 classic "Charade", a "romantic screwball comedy mystery film" starring Audrey Hepburn and Cary Grant to a DuckDB table. This movie was picked because it is accidentally in the Public Domain because a screw-up in the wording of the copyright notice (no, really). Because of this, you can actually freely download this movie from the Internet Archive.
Since we're just creating a table, we will use DuckDB's native storage format. Here is the complete code snippet we used to convert the movie. In fact, this code should actually be generic enough to convert anything that ffmpeg can read to a table. Just in case you would want to try this at home on your own movies.
import imageio
import duckdb

# setup movie reading
vid = imageio.get_reader("Charade-1963.mp4", "ffmpeg")
dim_x = vid.get_meta_data()['size'][0]
dim_y = vid.get_meta_data()['size'][1]
rows_per_frame = dim_y * dim_x

# setup a DuckDB database and table
con = duckdb.connect()
con.execute("ATTACH 'charade.duckdb' AS m (STORAGE_VERSION 'latest'); USE m;")
con.execute("CREATE TABLE movie (i BIGINT, y USMALLINT, x USMALLINT, r UTINYINT, g UTINYINT, b UTINYINT)")

# those offsets don't change between frames, so pre-compute them
con.execute("CREATE TEMPORARY TABLE y AS SELECT unnest(list_sort(repeat(range(?), ?))) y", [dim_y, dim_x])
con.execute("CREATE TEMPORARY TABLE x AS SELECT unnest(repeat(range(?), ?)) x", [dim_x, dim_y])

# loop over each frame in the movie and insert the pixel data
for i_idx, im in enumerate(vid):
    v = im.flatten()
    r = v[0:len(v):3]
    g = v[1:len(v):3]
    b = v[2:len(v):3]

    con.execute('''INSERT INTO movie
        FROM repeat(?, ?) i -- frame offset
        POSITIONAL JOIN   y -- temp table
        POSITIONAL JOIN   x -- temp table
        POSITIONAL JOIN   r -- numpy scan
        POSITIONAL JOIN   g -- numpy scan
        POSITIONAL JOIN   b -- numpy scan
        ''', [i_idx, rows_per_frame])
This script makes use of not just one, but (at least) two cool DuckDB features. First, we use so-called replacement scans to directly query the NumPy arrays r, g, and b. Note that those have not been created as tables in DuckDB nor registered in any way, but they are referenced by name in the INSERT. What happens here is that DuckDB inspects the Python context for the missing "tables" and finds objects with those names that it can read. The other cool feature is the POSITIONAL JOIN, which lets us stack multiple tables horizontally by position without running an actual (expensive) JOIN. This way, we assemble all the columns we need for a single frame in a bulk INSERT, which executes quite efficiently.
The movie file we have has a frame rate of 25 frames per second at a (DVD-ish) resolution of 720x392 pixels. The total runtime is 01:53:02.56 seconds, which comes down to 169 563 individual frames. Because we have a row for each pixel we end up with 169 563 * 720 x 392 rows, or 47 857 461 120. 47 billion rows! Finally Big Data! When stored as a DuckDB database however, the file size is "only" around 200 GB. Totally doable on a laptop!
DuckDB's lightweight compression performs quite well here, given that in a naive binary format we would have to store at least 15 bytes per row. If we multiply that with the row count (47 billion, remember) we would end up at around 700 GB in storage for this hypothetical naive format.
Of course, by turning the data into a relational table we add a bunch of previously implicit information due to the lack of ordering in relations. If we just stored the raw pixel bytes, for example as an implicitly ordered series of BMP (bitmap) files, we would end up with the same amount of bytes as the rows above times three, or 133 GB. Even including materializing all the offsets, the DuckDB file still manages to end up at a comparable size (200 GB). And of course, comparing the size of the table with the MPEG-4 version of the movie is not entirely fair because MPEG-4 is a lossy compression format. Databases can't just randomly decide to compromise on the numerical accuracy of the tables they store!
To prove that the transformation is accurate, let's try to turn the table data for one random frame back into a human-consumable picture: we will retrieve the corresponding rows from DuckDB, and use some Python magic to turn them back into a PNG image file:
import duckdb
import numpy as np
import PIL.Image

frame = 48000

con = duckdb.connect('charade.duckdb', read_only=True)
dim_y, dim_x = con.execute("SELECT max(y) + 1 dim_y, max(x) + 1 dim_x FROM movie WHERE i=0").fetchone()

res = con.execute("SELECT r, g, b FROM movie WHERE i = ? ORDER BY y, x", [frame]).fetchnumpy()
v = np.zeros(dim_y * dim_x * 3, dtype=np.uint8)
v[0:len(v):3] = res['r']
v[1:len(v):3] = res['g']
v[2:len(v):3] = res['b']

img = PIL.Image.fromarray(v.reshape((dim_y, dim_x, 3)))
img.save(f'frame.png')

And voila, we can see a wonderful frame with Audrey and Cary appear. This trick can also be used to create a sequence of pictures and write them to a MPEG-4 file again using – for example – the moviepy library.
But now that we have a table, we can have some fun with it. Let's do some basic exploration first: we start with DESCRIBE, which basically tells us the schema. We knew this of course.
DESCRIBE movie;
| column_name | column_type | null | key | default | extra |
|---|---|---|---|---|---|
| i | BIGINT | YES | NULL | NULL | NULL |
| y | USMALLINT | YES | NULL | NULL | NULL |
| x | USMALLINT | YES | NULL | NULL | NULL |
| r | UTINYINT | YES | NULL | NULL | NULL |
| g | UTINYINT | YES | NULL | NULL | NULL |
| b | UTINYINT | YES | NULL | NULL | NULL |
No surprises there. How many rows are there?
FROM movie SELECT count(*);
| count_star() |
|---|
| 47857461120 |
Ah yes, 47 billion. What are the numeric properties of the columns? DuckDB has this neat SUMMARIZE statement that computes single-pass summary statistics on a table (or arbitrary query).
SUMMARIZE movie;
This one is admittedly a bit of a flex. DuckDB can compute elaborate summary statistics on all the 47 billion rows in ca. 20 minutes on a MacBook. Here are the results:
| column_name | column_type | min | max | approx_unique | avg | std | q25 | q50 | q75 | count | null_percentage |
|---|---|---|---|---|---|---|---|---|---|---|---|
| i | BIGINT | 0 | 169562 | 150076 | 84781.0 | 48948.621846957954 | 42429 | 84751 | 127137 | 47857461120 | 0.00 |
| y | USMALLINT | 0 | 391 | 430 | 195.5 | 113.16028455346597 | 98 | 196 | 294 | 47857461120 | 0.00 |
| x | USMALLINT | 0 | 719 | 840 | 359.5 | 207.84589644146592 | 180 | 359 | 540 | 47857461120 | 0.00 |
| r | UTINYINT | 0 | 255 | 252 | 65.32575855816732 | 44.85627602555231 | 27 | 54 | 96 | 47857461120 | 0.00 |
| g | UTINYINT | 0 | 249 | 249 | 56.79713844669577 | 37.03562456032193 | 28 | 44 | 77 | 47857461120 | 0.00 |
| b | UTINYINT | 0 | 255 | 252 | 43.249715985643995 | 38.39218963268899 | 16 | 28 | 61 | 47857461120 | 0.00 |
Since we're basically storing a lot of colors, just how many different combinations of red, green and blue are there, DuckDB?
FROM (FROM movie SELECT DISTINCT r, g, b)
SELECT count(*);
Any seasoned data engineer would rightfully caution you to run a DISTINCT on this many rows. There have just been too many production outages caused by overflowing aggregations. But thanks to DuckDB's larger-than-memory aggregate hash table, we can confidently issue this query. We even get a nice progress bar and (since 1.4.0) a surprisingly accurate estimate of how long the query will take.
| count_star() |
|---|
| 826568 |
So roughly 800 thousand different colors. Computing this took about 2 minutes in the end. But what are the frequencies of those colors? Let's compute a histogram of the 10 most-used colors!
FROM movie
SELECT r, g, b, count(*) AS ct
GROUP BY ALL
ORDER BY ct DESC
LIMIT 10;
| r | g | b | ct |
|---|---|---|---|
| 17 | 20 | 15 | 106521429 |
| 23 | 25 | 15 | 93004303 |
| 23 | 25 | 13 | 85552738 |
| 13 | 22 | 15 | 81734796 |
| 22 | 24 | 13 | 76560295 |
| 24 | 26 | 15 | 75376896 |
| 15 | 19 | 8 | 74285763 |
| 23 | 24 | 19 | 72904497 |
| 22 | 24 | 12 | 69269099 |
| 24 | 26 | 16 | 62230136 |
The most common colors here seems to be dark shades of grey. Makes sense! Keep in mind that the MPEG-4 compression is lossy and will probably produce some odd colors as rounding artifacts.
But we can also have some more fun. We have an analytical database system. How about we compute the average frame for every thousand frames and stitch the results back into a movie? It's just a big aggregation. We first create the actual averages:
CREATE TABLE averages AS
    FROM movie
    SELECT
        i // 1000 AS idx,
        y,
        x,
        avg(r)::UTINYINT AS r,
        avg(g)::UTINYINT AS g,
        avg(b)::UTINYINT AS b
GROUP BY ALL
ORDER BY idx, y, x;
Then, we use Python again to turn this averages table into a movie:
# some setup omitted

# fetch a bunch of frames in bulk
res = con.execute("SELECT r, g, b FROM averages ORDER BY i, y, x").fetchnumpy()

# split the rgb arrays by frame again
r_splits = np.split(res['r'], num_frames)
g_splits = np.split(res['g'], num_frames)
b_splits = np.split(res['b'], num_frames)

# generate pictures
image_files = []
for i in range(num_frames):
    v = np.zeros(dim_y * dim_x * 3, dtype=np.uint8)
    v[0:len(v):3] = r_splits[i]
    v[1:len(v):3] = g_splits[i]
    v[2:len(v):3] = b_splits[i]
    image_files.append(v.reshape((dim_y, dim_x, 3), order='C'))

# write movie file
clip = moviepy.video.io.ImageSequenceClip.ImageSequenceClip(image_files, fps=25)
clip.write_videofile('averages.mp4')
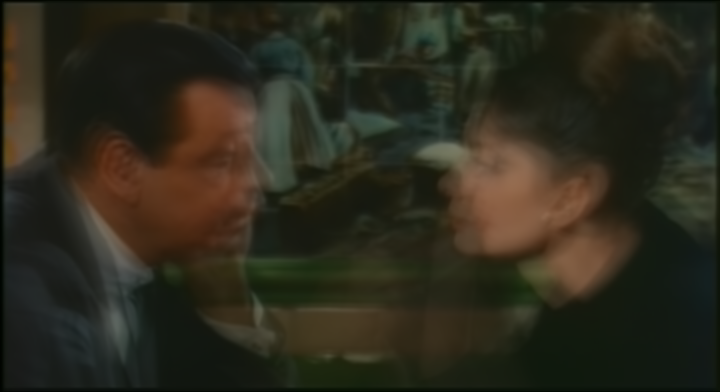
There is some wrangling here because we want to retrieve the whole frame dataset in bulk and not run a query for every single one. We then use NumPy to split them into frames and stitch the RGB-channels together into the three-dimensional array that the image libraries like. This does not achieve any business purpose but the results are kind of funny, here is average frame #68, with apologies to the actors:
We can also stitch all the averages together to make a somewhat twitchy average movie:
Click here to see the twitchy movie generated from “Charade”:

For some added fun, we could even write a SQL query that turns a frame into a HTML table with one-pixel fields. Below is the result, let's hope your browser can render this and let's thank Cloudflare again for sponsoring our traffic. Here is the somewhat unholy query to generate this:
SELECT '<html><body><table style="padding:0px; margin: 0px; border-collapse: collapse;">';
FROM movie
SELECT
    IF(x = 0, '<tr>', '') ||
    printf('<td style="background-color: #%02x%02x%02x; height: 1px; width: 1px"; ></td>', r, g, b) ||
    IF(x = 719, '</tr>', '')
WHERE i = 48000
ORDER BY y, x;
SELECT '</table></body></html>';
You can see the result in movies-table.html (keep in mind that it's 20 MB and renders each movie pixels as a table field!).
Conclusion
You can probably tell that this post is not entirely serious. Fun was had. But what did we learn? A few things: first, basically anything can be represented as a table, even an obscure 1963 movie. In the grand scheme of things, it is probably not a great idea, there are amazing open-source libraries like ffmpeg and apps like VLC to deal with movie files, or similarly with their array cousins that contain music or just images. Despite the massive blow-up and billions of rows of data, DuckDB actually handled this pretty well, both its data format and its execution engine. Here at team DuckDB, our mission is to raise your overall confidence wrangling data of all shapes and sizes, and we hope this post contributes to that. And to finish up, just pay attention to your copyright notices!

