Benchmarking Ourselves over Time at DuckDB

TL;DR: In the last 3 years, DuckDB has become 3-25× faster and can analyze ~10× larger datasets all on the same hardware.
A big part of DuckDB's focus is on the developer experience of working with data. However, performance is an important consideration when investigating data management systems. Fairly comparing data processing systems using benchmarks is very difficult. Whoever creates the benchmark is likely to know one system better than the rest, influencing benchmark selection, how much time is spent tuning parameters, and more.
Instead, this post focuses on benchmarking our own performance over time. This approach avoids many comparison pitfalls, and also provides several valuable data points to consider when selecting a system.
-
How fast is it improving? Learning a new tool is an investment. Picking a vibrant, rapidly improving database ensures your choice pays dividends for years to come. Plus, if you haven't experimented with a tool in a while, you can see how much faster it has become since you last checked!
-
What is it especially good at? The choice of benchmark is an indicator of what types of workloads a tool is useful for. The higher the variety of analyses in the benchmark, the more broadly useful the tool can be.
-
What scale of data can it handle? Many benchmarks are deliberately smaller than typical workloads. This allows the benchmark to complete in a reasonable amount of time when run with many configurations. However, an important question to answer when selecting a system is whether the size of your data can be handled within the size of your compute resources.
There are some limitations when looking at the performance of a system over time. If a feature is brand new, there is no prior performance to compare to! As a result, this post focuses on fundamental workloads rather than DuckDB's ever-increasing set of integrations with different lakehouse data formats, cloud services, and more.
The code used to run the benchmark also avoids many of DuckDB's Friendlier SQL additions, as those have also been added more recently. (When writing these queries, it felt like going back in time!)
Benchmark Design Summary
This post measures DuckDB's performance over time using the H2O.ai benchmark, plus some new benchmarks added for importing, exporting, and using window functions. Please see our previous blog posts for details on why we believe the H2O.ai benchmark is a good approach! The full details of the benchmark design are in the appendix.
- H2O.ai, plus import/export and window function tests
- Python instead of R
- 5 GB scale for everything, plus 50 GB scale for group bys and joins
- Median of 3 runs
- Using a MacBook Pro M1 with 16 GB RAM
- DuckDB versions 0.2.7 through 1.0.0
- Nearly 3 years, from 2021-06-14 to 2024-06-03
- Default settings
- Pandas pre-version 0.5.1, Apache Arrow 0.5.1+
Overall Benchmark Results
The latest DuckDB can complete one run of the full benchmark suite in under 35 seconds, while version 0.2.7 required nearly 500 seconds for the same task in June 2021. That is 14 times faster, in only 3 years!
Performance over Time
Note These graphs are interactive, thanks to Plotly.js! Feel free to filter the various series (single click to hide, double click to show only that series) and click-and-drag to zoom in. Individual benchmark results are visible on hover.
The above plot shows the median runtime in seconds for all tests. Due to the variety of uses for window functions, and their relative algorithmic complexity, the 16 window function tests require the most time of any category.
This plot normalizes performance to the latest version of DuckDB to show relative improvements over time. If you look at the point in time when you most recently measured DuckDB performance, that number will show you how many times faster DuckDB is now!
A portion of the overall improvement is DuckDB's addition of multi-threading, which became the default in November 2021 with version 0.3.1.
DuckDB also moved to a push-based execution model in that version for additional gains.
Parallel data loading boosted performance in December 2022 with version 0.6.1, as did improvements to the core JOIN algorithm.
We will explore other improvements in detail later in the post.
However, we see that all aspects of the system have seen improvements, not just raw query performance! DuckDB focuses on the entire data analysis workflow, not just aggregate or join performance. CSV parsing has seen significant gains, import and export have improved significantly, and window functions have improved the most of all.
What was the slight regression from December 2022 to June 2023? Window functions received additional capabilities and experienced a slight performance degradation in the process. However, from June 2023 onward we see substantial performance improvement across the board for window functions. If window functions are filtered out of the chart, we see a smoother trend.
You may also notice that starting with version 0.9 in September 2023, the performance appears to plateau. What is happening here? First, don't forget to zoom in! Over the last year, DuckDB has still improved over 3×! More recently, the DuckLabs team focused on scalability by developing algorithms that support larger-than-memory calculations. We will see the fruits of those labors in the scale section later on! In addition, DuckDB focused exclusively on bug fixes in versions 0.10.1, 0.10.2, and 0.10.3 in preparation for an especially robust DuckDB 1.0. Now that those two major milestones (larger than memory calculations and DuckDB 1.0) have been accomplished, performance improvements will resume! It is worth noting that the boost from moving to multi-threading will only occur once, but there are still many opportunities moving forward.
Performance by Version
We can also recreate the overall plot by version rather than by time. This demonstrates that DuckDB has been doing more frequent releases recently. See DuckDB's release calendar for the full version history.
If you remember the version that you last tested, you can compare how much faster things are now with 1.0!
Results by Workload
CSV Reader
DuckDB has invested substantially in building a fast and robust CSV parser. This is often the first task in a data analysis workload, and it tends to be undervalued and underbenchmarked. DuckDB has improved CSV reader performance by nearly 3×, while adding the ability to handle many more CSV dialects automatically.
Group By
Group by or aggregation operations are critical steps in OLAP workloads, and have therefore received substantial focus in DuckDB, improving over 12× in the last 3 years.
In November 2021, version 0.3.1 enabled multithreaded aggregation by default, providing a significant speedup.
In December 2022, data loads into tables were parallelized with the release of version 0.6.1. This is another example of improving the entire data workflow, as this group by benchmark actually stressed the insertion performance substantially. Inserting the results was taking the majority of the time!
Enums were also used in place of strings for categorical columns in version 0.6.1. This means that DuckDB was able to use integers rather than strings when operating on those columns, further boosting performance.
Despite what appears at first glance to be a performance plateau, zooming in to 2023 and 2024 reveals a ~20% improvement. In addition, aggregations have received significant attention in the most recent versions to enable larger-than-memory aggregations. You can see that this was achieved while continuing to improve performance for the smaller-than-memory case.
Join
Join operations are another area of focus for analytical databases, and DuckDB in particular. Join speeds have improved by 4× in the last 3 years!
Version 0.6.1 in December 2022 introduced improvements to the out-of-core hash join that actually improved the smaller-than-memory case as well. Parallel data loading from 0.6.1 also helps in this benchmark as well, as some results are the same size as the input table.
In recent versions, joins have also been upgraded to support larger-than-memory capabilities. This focus has also benefitted the smaller-than-memory case and has led to the improvements in 0.10, launched in February 2024.
Window Functions
Over the time horizon studied, window functions have improved a dramatic 25×!
Window function performance was improved substantially with the 0.9.0 release in September 2023. 14 different performance optimizations contributed. Aggregate computation was vectorized (with special focus on the segment tree data structure). Work stealing enabled multi-threaded processing and sorting was adapted to run in parallel. Care was also taken to pre-allocate memory in larger batches.
DuckDB's window functions are also capable of processing larger-than-memory datasets. We leave benchmarking that feature for future work!
Export
Often DuckDB is not the final step in a workflow, so export performance has an impact. Exports are 10× faster now! Until recently, the DuckDB format was not backward compatible, so the recommended long term persistence format was Parquet. Parquet is also critical to interoperability with many other systems, especially data lakes. DuckDB works well as a workflow engine, so exporting to other in-memory formats is quite common as well.
In the September 2022 release (version 0.5.1) we see significant improvements driven by switching from Pandas to Apache Arrow as the recommended in-memory export format. DuckDB's underlying data types share many similarities with Arrow, so data transfer is quite quick.
Parquet export performance has improved by 4–5× over the course of the benchmark, with dramatic improvements in versions 0.8.1 (June 2023) and 0.10.2 (April 2024). Version 0.8.1 added parallel Parquet writing while continuing to preserve insertion order.
The change driving the improvement in 0.10.2 was more subtle. When exporting strings with high cardinality, DuckDB decides whether or not to do dictionary compression depending on if it reduces file size. From 0.10.2 onward, the compression ratio is tested after a sample of the values are inserted into the dictionary, rather than after all values are added. This prevents substantial unnecessary processing for high-cardinality columns where dictionary compression is unhelpful.
Exporting Apache Arrow vs. Pandas vs. Parquet
This plot shows the performance of all three export formats over the entire time horizon (rather than picking the winner between Pandas and Arrow). It allows us to see at what point Apache Arrow passes Pandas in performance.
Pandas export performance has improved substantially over the course of the benchmark. However, Apache Arrow has proven to be the more efficient data format, so Arrow is now preferred for in-memory exports. Interestingly, DuckDB's Parquet export is now so efficient that it is faster to write a persistent Parquet file than it is to write to an in-memory Pandas dataframe! It is even competitive with Apache Arrow.
Scan Other Formats
In some use cases, DuckDB does not need to store the raw data, but instead should simply read and analyze it. This allows DuckDB to fit seamlessly into other workflows. This benchmark measures how fast DuckDB can scan and aggregate various data formats.
To enable comparisons over time, we switch from Pandas to Arrow at version 0.5.1 as mentioned. DuckDB is over 8× faster in this workload, and the absolute time required is very short. DuckDB is a great fit for this type of work!
Scanning Apache Arrow vs. Pandas vs. Parquet
Once again, we examine all three formats over the entire time horizon.
When scanning data, Apache Arrow and Pandas are more comparable in performance. As a result, while Arrow is clearly preferable for exports, DuckDB will happily read Pandas with similar speed. However, in this case, the in-memory nature of both Arrow and Pandas allow them to perform 2–3× faster than Parquet. In absolute terms, the time required to complete this operation is a very small fraction of the benchmark, so other operations should be the deciding factor.
Scale tests
Analyzing larger-than-memory data is a superpower for DuckDB, allowing it to be used for substantially larger data analysis tasks than were previously possible.
In version 0.9.0, launched in September 2023, DuckDB's hash aggregate was enhanced to handle out-of-core (larger than memory) intermediates. The details of the algorithm, along with some benchmarks, are available in this blog post. This allows for DuckDB to aggregate one billion rows of data (50 GB in size) on a MacBook Pro with only 16 GB of RAM, even when the number of unique groups in the group by is large. This represents at least a 10× improvement in aggregate processing scale over the course of the 3 years of the benchmark.
DuckDB's hash join operator has supported larger-than-memory joins since version 0.6.1 in December 2022. However, the scale of this benchmark (coupled with the limited RAM of the benchmarking hardware), meant that this benchmark could still not complete successfully. In version 0.10.0, launched in February 2024, DuckDB's memory management received a significant upgrade to handle multiple concurrent operators all requiring significant memory. The 0.10.0 release blog post shares additional details about this feature.
As a result, by version 0.10.0 DuckDB was able to handle calculations on data that is significantly larger than memory, even if the intermediate calculations are large in size. All operators are supported, including sorting, aggregating, joining, and windowing. Future work can further test the boundaries of what is possible with DuckDB's out-of-core support, including window functions and even larger data sizes.
Hardware Capabilities over Time
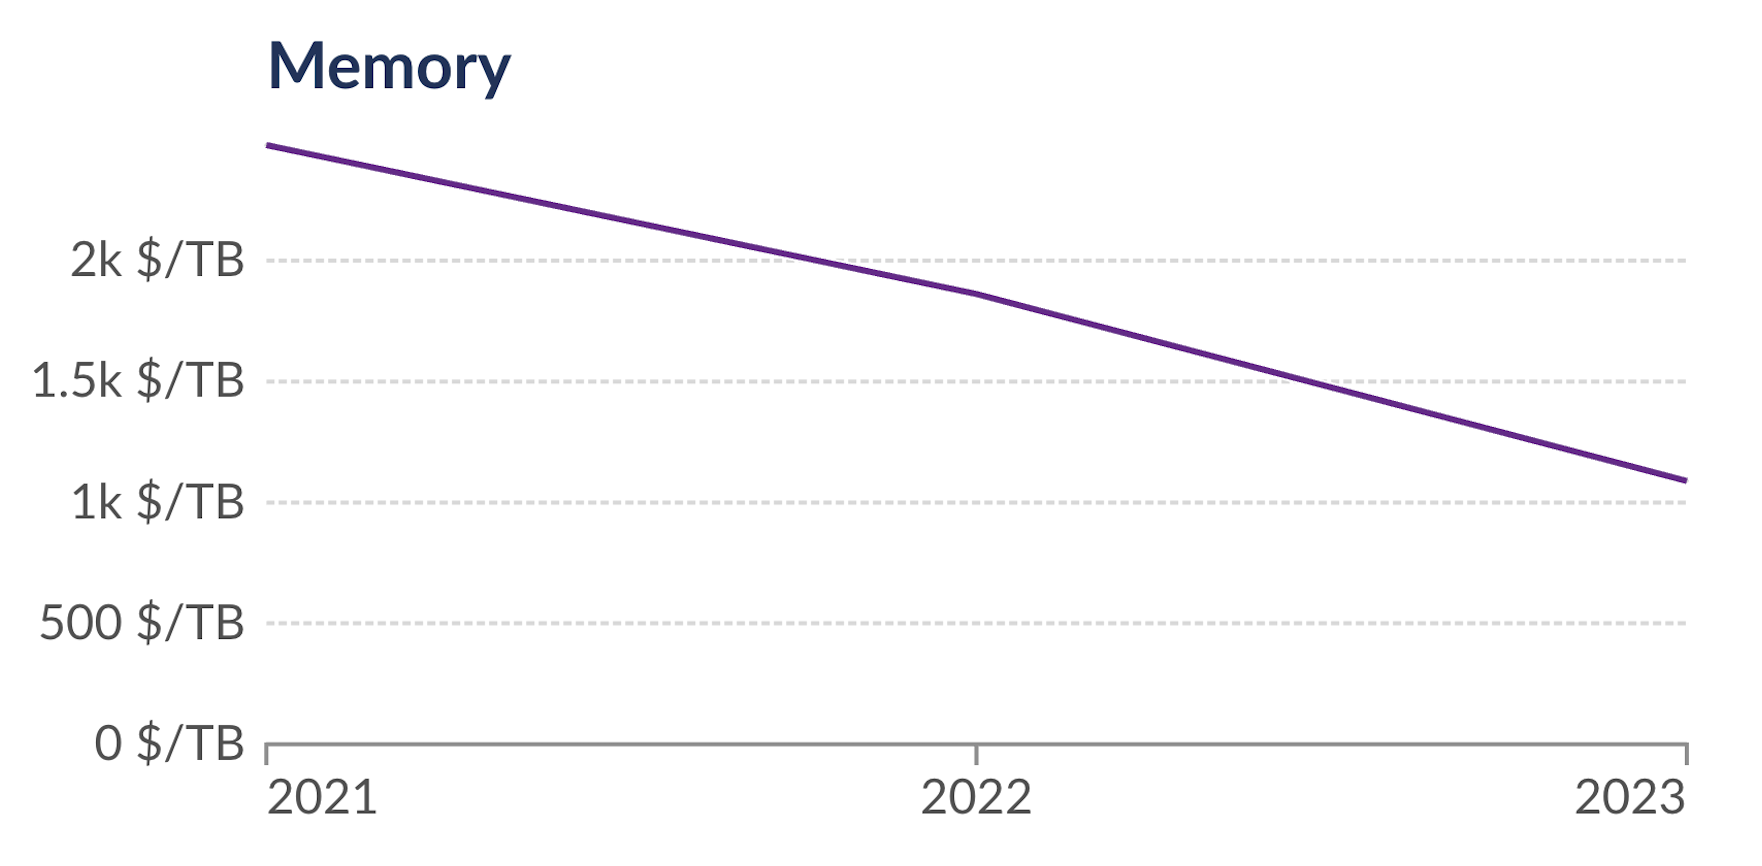
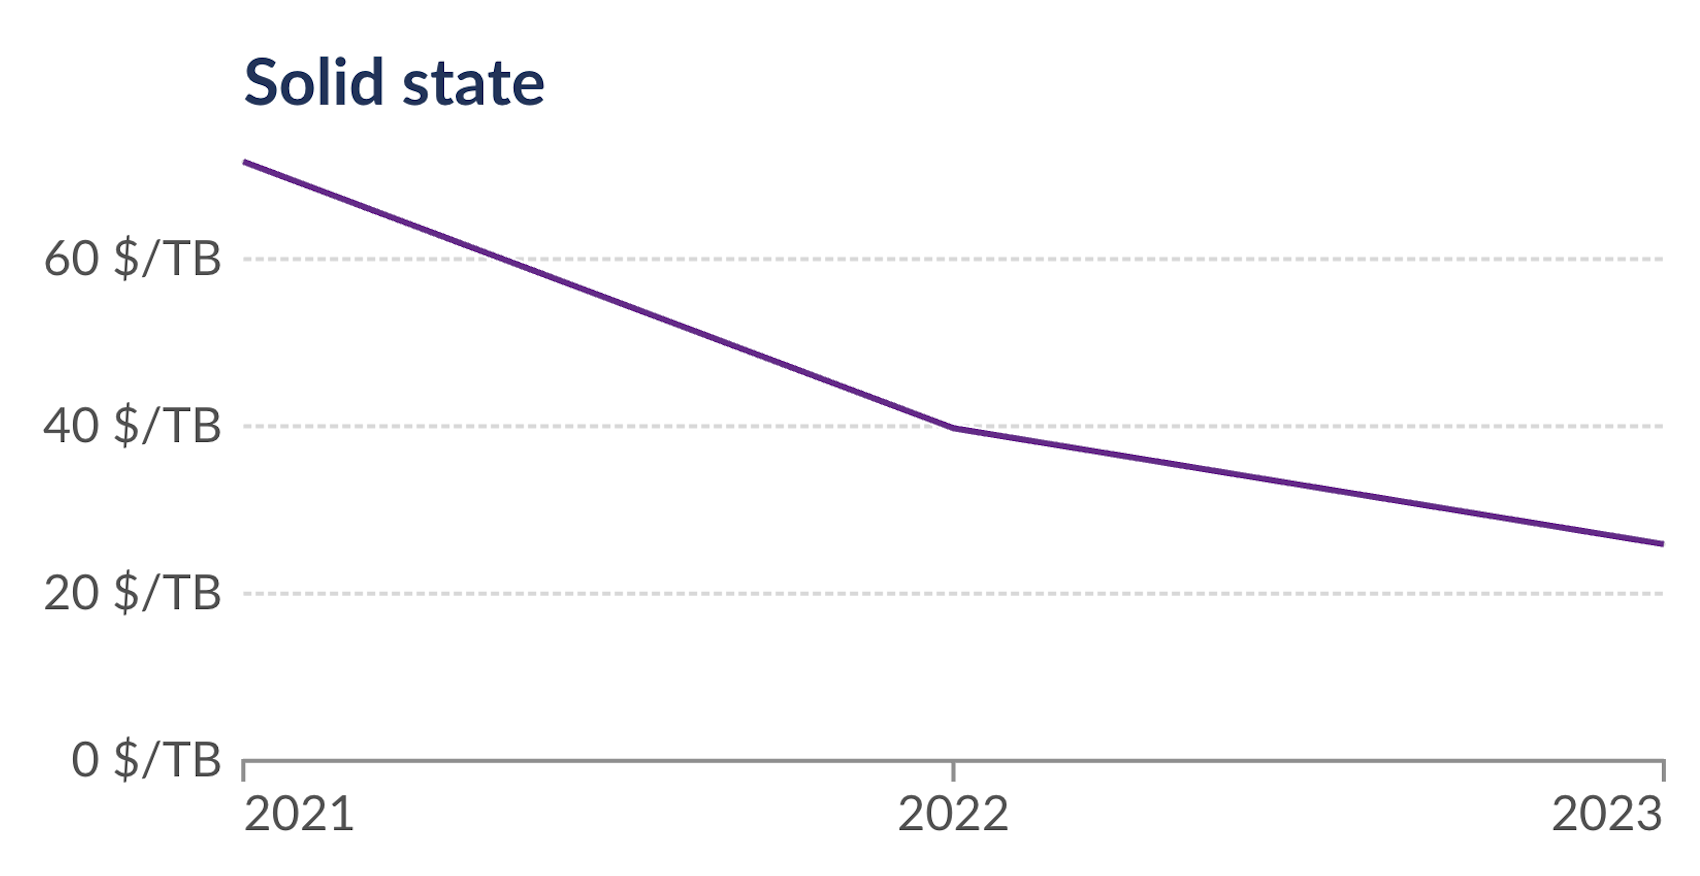
DuckDB's performance on the same hardware has improved dramatically, and at the same time, the capabilities of hardware are increasing rapidly as well.
 Source: Our World in Data
The price of RAM has declined by 2.2× and the price of SSD storage has decreased by 2.7× from 2021 to 2023 alone. Thanks to the combination of DuckDB enhancements and hardware prices, the scale of analysis possible on a single node has increased by substantially more than an order of magnitude in just 3 years!
Analyzing the Results Yourself
A DuckDB 1.0 database containing the results of these benchmarks is available at https://blobs.duckdb.org/data/duckdb_perf_over_time.duckdb.
Any DuckDB client with the httpfs extension can read that file.
You can even use the DuckDB Wasm web shell to query the file directly from your browser (with the queries pre-populated and automatically executed!):
LOAD httpfs;
ATTACH 'https://blobs.duckdb.org/data/duckdb_perf_over_time.duckdb' AS performance_results;
USE performance_results;
The file contains two tables: benchmark_results and scale_benchmark_results.
Please let us know if you uncover any interesting findings!
Conclusion
In summary, not only is DuckDB's feature set growing substantially with each release, DuckDB is getting faster very fast! Overall, performance has improved by 14× in only 3 years!
Yet query performance is only part of the story! The variety of workloads that DuckDB can handle is wide and growing wider thanks to a full-featured SQL dialect, including high performance window functions. Additionally, critical workloads like data import, CSV parsing, and data export have improved dramatically over time. The complete developer experience is critical for DuckDB!
Finally, DuckDB now supports larger-than-memory calculations across all operators: sorting, aggregating, joining, and windowing. The size of problem that you can handle on your current compute resources just got 10× bigger, or more!
If you have made it this far, welcome to the flock! 🦆 Join us on Discord, we value your feedback!
Appendix
Benchmark Design
H2O.ai as the Foundation
This post measures DuckDB's performance over time on the H2O.ai benchmark for both joins and group by queries.
The result of each H2O.ai query is written to a table in a persistent DuckDB file. This does require additional work when compared with an in-memory workflow (especially the burden on the SSD rather than RAM), but improves scalability and is a common approach for larger analyses.
As in the current H2O.ai benchmark, categorical-type columns (VARCHAR columns with low cardinality) were converted to the ENUM type as a part of the benchmark.
The time for converting into ENUM columns was included in the benchmark time, and resulted in a lower total amount of time (so the upfront conversion was worthwhile).
However, the ENUM data type was not fully operational in DuckDB until version 0.6.1 (December 2022), so earlier versions skip this step.
Python Client
To measure interoperability with other dataframe formats, we have used Python rather than R (used by H2O.ai) for this analysis. We do continue to use R for the data generation step for consistency with the benchmark. Python is DuckDB's most popular client, great for data science, and also the author's favorite language for this type of work.
Export and Replacement Scans
We now extend this benchmark in several important ways. In addition to considering raw query performance, we measure import and export performance with several formats: Pandas, Apache Arrow, and Apache Parquet. The results of both the join and group by benchmarks are exported to each format.
When exporting to dataframes, we measured the performance in both cases. However, when summarizing the total performance, we chose the best performing format at the time. This likely mirrors the behavior of performance-sensitive users (as they would likely not write to both formats!). In version 0.5.1, released September 2022, DuckDB's performance when writing to and reading from the Apache Arrow format surpassed Pandas. As a result, versions 0.2.7 to 0.4.0 use Pandas, and 0.5.1 onward uses Arrow.
On the import side, replacement scans allow DuckDB to read those same formats without a prior import step. In the replacement scan benchmark, the data that is scanned is the output of the final H2O.ai group by benchmark query. At the 5 GB scale it is a 100 million row dataset. Only one column is read, and a single aggregate is calculated. This focuses the benchmark on the speed of scanning the data rather than DuckDB's aggregation algorithms or speed of outputting results. The query used follows the format:
SELECT
    sum(v3) AS v3
FROM dataframe_or_Parquet_file;
Window Functions
We also added an entire series of window function benchmarks. Window functions are a critical workload in real world data analysis scenarios, and can stress test a system in other ways. DuckDB has implemented state of the art algorithms to quickly process even the most complex window functions. We use the largest table from the join benchmark as the raw data for these new tests to help with comparability to the rest of the benchmark.
Window function benchmarks are much less common than more traditional joins and aggregations, and we were unable to find a suitable suite off the shelf. These queries were designed to showcase the variety of uses for window functions, but there are certainly more that could be added. We are open to your suggestions for queries to add, and hope these queries could prove useful for other systems!
Since the window functions benchmark is new, the window functions from each of the queries included are shown in the appendix at the end of the post.
Workload Size
We test only the middle 5 GB dataset size for the workloads mentioned thus far, primarily because some import and export operations to external formats like Pandas must fit in memory (and we used a MacBook Pro M1 with only 16 GB of RAM). Additionally, running the tests for 21 DuckDB versions was time-intensive even at that scale, due to the performance of older versions.
Scale Tests
Using only 5 GB of data does not answer our second key question: “What scale of data can it handle?”! We also ran only the group by and join related operations (avoiding in-memory imports and exports) at the 5 GB and the 50 GB scale. Older versions of DuckDB could not handle the 50 GB dataset when joining or aggregating, but modern versions can handle both, even on a memory-constrained 16 GB RAM laptop. Instead of measuring performance, we measure the size of the benchmark that was able to complete on a given version.
Summary Metrics
With the exception of the scale tests, each benchmark was run 3 times and the median time was used for reporting results. The scale tests were run once and produced a binary metric, success or failure, at each data size tested. As older versions would not fail gracefully, the scale metrics were accumulated across multiple partial runs.
Computing Resources
All tests use a MacBook Pro M1 with 16 GB of RAM. In 2024, this is far from state of the art! If you have more powerful hardware, you will see both improved performance and scalability.
DuckDB Versions
Version 0.2.7, published in June 2021, was the first version to include a Python client compiled for ARM64, so it was the first version that could easily run on the benchmarking compute resources. Version 1.0.0 is the latest available at the time of publication (June 2024), although we also provide a sneak preview of an in-development feature branch.
Default Settings
All versions were run with the default settings. As a result, improvements from a new feature only appear in these results once that feature became the default and was therefore ready for production workloads.
Window Functions Benchmark
Each benchmark query follows the format below, but with different sets of window functions in the window_function(s) placeholder.
The table in use is the largest table from the H2O.ai join benchmark, and in this case the 5 GB scale was used.
DROP TABLE IF EXISTS windowing_results;

CREATE TABLE windowing_results AS
    SELECT
        id1,
        id2,
        id3,
        v2,
        window_function(s)
    FROM join_benchmark_largest_table;
The various window functions that replace the placeholder are below and are labelled to match the result graphs. These were selected to showcase the variety of use cases for window functions, as well as the variety of algorithms required to support the full range of the syntax. The DuckDB documentation contains a full railroad diagram of the available syntax. If there are common use cases for window functions that are not well-covered in this benchmark, please let us know!
/* 302 Basic Window */
sum(v2) OVER () AS window_basic

/* 303 Sorted Window */
first(v2) OVER (ORDER BY id3) AS first_order_by,
row_number() OVER (ORDER BY id3) AS row_number_order_by

/* 304 Quantiles Entire Dataset */
quantile_cont(v2, [0, 0.25, 0.50, 0.75, 1]) OVER ()
    AS quantile_entire_dataset

/* 305 PARTITION BY */
sum(v2) OVER (PARTITION BY id1) AS sum_by_id1,
sum(v2) OVER (PARTITION BY id2) AS sum_by_id2,
sum(v2) OVER (PARTITION BY id3) AS sum_by_id3

/* 306 PARTITION BY ORDER BY */
first(v2) OVER
    (PARTITION BY id2 ORDER BY id3) AS first_by_id2_ordered_by_id3

/* 307 Lead and Lag */
first(v2) OVER
    (ORDER BY id3 ROWS BETWEEN 1 PRECEDING AND 1 PRECEDING)
    AS my_lag,
first(v2) OVER
    (ORDER BY id3 ROWS BETWEEN 1 FOLLOWING AND 1 FOLLOWING)
    AS my_lead

/* 308 Moving Averages */
avg(v2) OVER
    (ORDER BY id3 ROWS BETWEEN 100 PRECEDING AND CURRENT ROW)
    AS my_moving_average,
avg(v2) OVER
    (ORDER BY id3 ROWS BETWEEN id1 PRECEDING AND CURRENT ROW)
    AS my_dynamic_moving_average

/* 309 Rolling Sum */
sum(v2) OVER
    (ORDER BY id3 ROWS BETWEEN UNBOUNDED PRECEDING AND CURRENT ROW)
    AS my_rolling_sum

/* 310 RANGE BETWEEN */
sum(v2) OVER
    (ORDER BY v2 RANGE BETWEEN 3 PRECEDING AND CURRENT ROW)
    AS my_range_between,
sum(v2) OVER
    (ORDER BY v2 RANGE BETWEEN id1 PRECEDING AND CURRENT ROW)
    AS my_dynamic_range_between

/* 311 Quantiles PARTITION BY */
quantile_cont(v2, [0, 0.25, 0.50, 0.75, 1])
    OVER (PARTITION BY id2)
    AS my_quantiles_by_id2

/* 312 Quantiles PARTITION BY ROWS BETWEEN */
first(v2) OVER
    (PARTITION BY id2 ORDER BY id3 ROWS BETWEEN 1 PRECEDING AND 1 PRECEDING)
    AS my_lag_by_id2,
first(v2) OVER
    (PARTITION BY id2 ORDER BY id3 ROWS BETWEEN 1 FOLLOWING AND 1 FOLLOWING)
    AS my_lead_by_id2

/* 313 Moving Averages PARTITION BY */
avg(v2) OVER
    (PARTITION BY id2 ORDER BY id3 ROWS BETWEEN 100 PRECEDING AND CURRENT ROW)
    AS my_moving_average_by_id2,
avg(v2) OVER
    (PARTITION BY id2 ORDER BY id3 ROWS BETWEEN id1 PRECEDING AND CURRENT ROW)
    AS my_dynamic_moving_average_by_id2

/* 314 Rolling Sum PARTITION BY */
sum(v2) OVER
    (PARTITION BY id2 ORDER BY id3 ROWS BETWEEN UNBOUNDED PRECEDING AND CURRENT ROW)
    AS my_rolling_sum_by_id2

/* 315 RANGE BETWEEN PARTITION BY */
sum(v2) OVER
    (PARTITION BY id2 ORDER BY v2 RANGE BETWEEN 3 PRECEDING AND CURRENT ROW)
    AS my_range_between_by_id2,
sum(v2) OVER
    (PARTITION BY id2 ORDER BY v2 RANGE BETWEEN id1 PRECEDING AND CURRENT ROW)
    AS my_dynamic_range_between_by_id2

/* 316 Quantiles PARTITION BY ROWS BETWEEN */
quantile_cont(v2, [0, 0.25, 0.50, 0.75, 1]) OVER
    (PARTITION BY id2 ORDER BY id3 ROWS BETWEEN 100 PRECEDING AND CURRENT ROW)
    AS my_quantiles_by_id2_rows_between

