duckplyr: dplyr Powered by DuckDB

TL;DR: The new R package duckplyr translates the dplyr API to DuckDB's execution engine.
For the duckplyr documentation, visit
duckplyr.tidyverse.org.
Background
Wrangling tabular data into a form suitable for analysis can be a challenging task. Somehow, every data set is created differently. Differences between datasets exist in their logical organization of information into rows and columns or in more specific choices like the representation of dates, currency, categorical values, missing data and so on. The task is not simplified by the lack of global consensus on trivial issues like which character to use as a decimal separator. To gain new insights, we also commonly need to combine information from multiple sources, for example by joining two data sets using a common identifier. There are some common recurring operations however, that have been found to be universally useful in reshaping data for analysis. For example, the Structured (English) Query Language, or SQL (“See-Quel”) for short describes a set of common operations that can be applied to tabular data like selection, projections, joins, aggregation, sorting, windowing, and more. SQL proved to be a huge success, despite its many warts and many attempts to replace it, it is still the de-facto language for data transformation with a gigantic industry behind it.
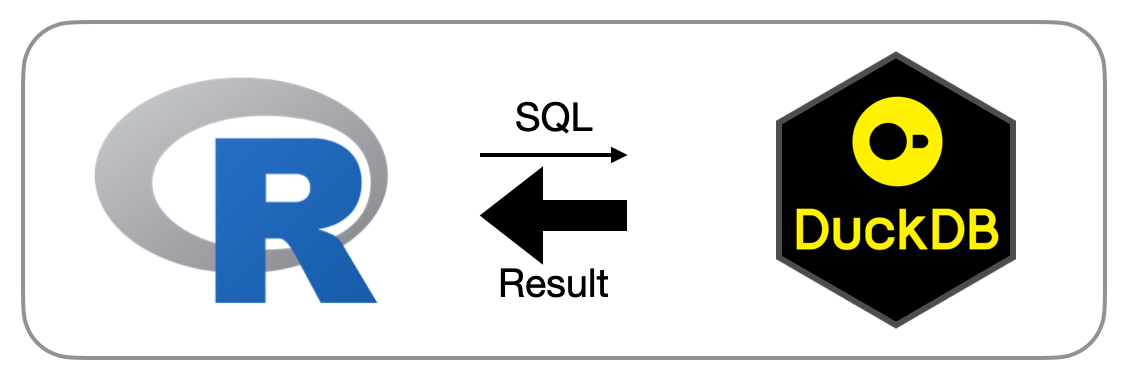
library("DBI")
con <- dbConnect(...)
df <- dbGetQuery(con, "SELECT something, very, complicated FROM some_table JOIN another_table BY (some_shared_attribute) GROUP BY group_one, group_two ORDER BY some_column, and_another_column;")
A not very ergonomic way of pulling data into R
For data analysts in interactive programming environments like R or Python possibly from within IDEs such as RStudio or Jupyter Notebooks, using SQL to reshape data was never really a natural choice. Sure, sometimes it was required to use SQL to pull data from operational systems as shown above, but when given a choice, analysts much preferred to use the more ergonomic data reshaping facilities provided by those languages. R had built-in data wrangling from the start as part of the language with the data.frame class to represent tabular data. Later on, in 2014, Hadley Wickham defined the logical structure of tabular data for so-called “tidy” data and published the first version of the dplyr package designed to unify and simplify the previously unwieldy R commands to reshape data into a singular, unified and consistent API. In Python-land, the widely popular Pandas project extended Python with a de-facto tabular data representation along with relational-style operators albeit without any attempt at “tidiness”.
At some point however, the R and Python data processing facilities started to creak under the ever-increasing weight of datasets that people wished to analyze. Datasets quickly grew into millions of rows. For example, one of the early datasets that required special handling was the American Community Survey dataset, because there are just so many Americans. But tools like Pandas and dplyr had been designed for convenience, not necessarily efficiency. For example, they lack the ability to parallelize data reshaping jobs on the now-common multicore processors.
And while there was a whole set of emerging “Big Data” tools, using those from an interactive data analysis environment proved to be a poor developer experience, for example due to multi-second job startup times and very complex setup procedures far beyond the skill set of most data analysts. However, the world of relational data management systems had not stood still in the meantime. Great progress had been made to improve the efficiency of analytical data analysis from SQL: Innovations around columnar data representation, efficient query interpretation or even compilation, and automatic efficient parallelization increased query processing efficiency by several orders of magnitude. Regrettably, those innovations did not find their way into the data analysts toolkit – even as decades passed – due to lack of communication between communities and siloing of innovations into corporate, commercial, and close-source products.
There are two possible ways out of this unfortunate scenario:
- improve the data analysis capabilities of R and Python to be able to handle larger datasets through general efficiency improvements, optimization, and parallelization;
- somehow integrate existing state-of-the-art technology into interactive data analysis environments.
The main issue with approach one is that building a competitive analytical query engine from scratch is a multi-million dollar effort requiring a team of highly specialized experts on query engine construction. There are many moving highly complex parts that all have to play together nicely. There are seemingly-obvious questions in query engines that one can get a PhD in data management systems for a solution. Recouping such a massive investment in a space where it is common that tools are built by volunteers in their spare time and released for free is challenging. That being said, there are a few commendable projects in this space like data.table or more recently pola.rs that offer greatly improved performance over older tools.
Approach two is also not without its challenges: State of the art query engine technology is often hidden behind incompatible architectures. For example, the two-tier architecture where a data management system runs on a dedicated database server and client applications use a client protocol to interact with said server is rather incompatible with interactive analysis. Setting up and maintaining a separate database “server” – even on the same computer – is still painful. Moving data back and forth between the analysis environment and the database server has been shown to be quite expensive. Unfortunately, those architectural decisions deeply influence the query engine trade-offs and are therefore difficult to change afterwards.

There has been movement in this space however: One of the stated goals of DuckDB is to unshackle state-of-the-art analytical data management technology from system architecture with its in-process architecture. Simply put, this means there is no separate database server and DuckDB instead runs within a “host” process. This host can be any application that requires data management capabilities or just an interactive data analysis environment like Python or R. Running within the host environment has another massive advantage: Moving data back and forth between the host and DuckDB is very cheap. For R and Python, DuckDB can directly run complex queries on data frames within the analysis environment without any import or conversion steps. Conversely, DuckDB’s query results can directly be converted to data frames, greatly reducing the overhead of integrating with downstream libraries for plotting, further analysis or Machine Learning. DuckDB is able to efficiently execute arbitrarily complex relational queries including recursive and correlated queries. DuckDB is able to handle larger-than-memory datasets both in reading and writing but also when dealing with large intermediate results, for example resulting from aggregations with millions of groups. DuckDB has a sophisticated full query optimizer that removes the previously common manual optimization steps. DuckDB also offers persistence, tabular data being stored in files on disk. The tables in those files can be changed, too – while keeping transactional integrity. Those are unheard-of features in interactive data analysis, they are the result of decades of research and engineering in analytical data systems.
One issue remains however, DuckDB speaks SQL. While SQL is a popular language, not all analysts want to express their data transformations in SQL. One of the main issues here is that typically, queries are expressed as strings in R or Python scripts, which are sent to a database system in an opaque way. This means that those queries carry all-or-nothing semantics and it can be challenging to debug problems (“You have an error in your SQL syntax; check the manual…”). APIs like dplyr are often more convenient for the user, they allow an IDE to support things like auto-completion on functions, variable names etc. In addition, the additive nature of the dplyr API allows to build a sequence of data transformation in small steps, which reduces the cognitive load of the analyst considerably compared to writing a hundred-line SQL query. There have been some early experimental attempts to overload R’s native data frame API in order to map to SQL databases, but those approaches have been found to be too limited in generality, surprising to users and generally too brittle. A better approach is needed.
The duckplyr R Package
To address those issues, we have partnered up with the dplyr project team at Posit (formerly RStudio) and cynkra to develop duckplyr. duckplyr is a drop-in replacement for dplyr, powered by DuckDB for performance. Duckplyr implements several innovations in the interactive analysis space. First of all, installing duckplyr is just as easy as installing dplyr. DuckDB has been packaged for R as a stand-alone R package that contains the entire data management system code as well as wrappers for R. Both the DuckDB R package as well as duckplyr are available on CRAN, making installation on all major platforms a straightforward:
install.packages("duckplyr")
Verbs
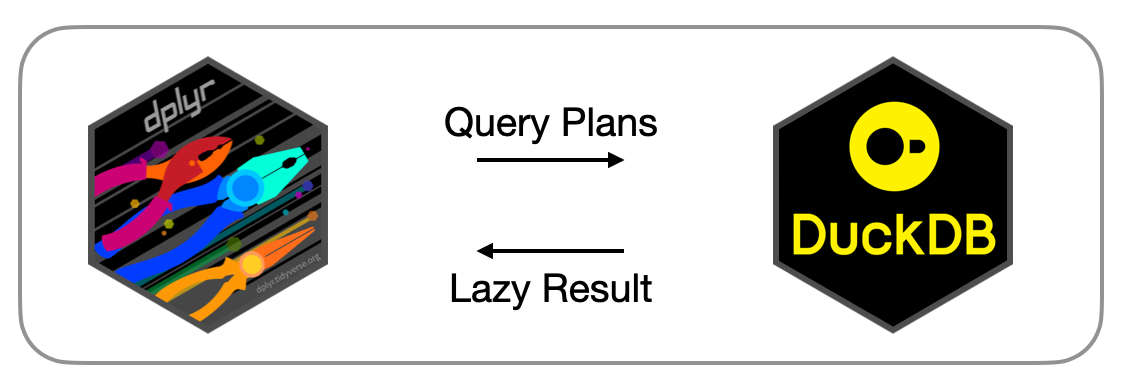
Under the hood, duckplyr translates the sort-of-relational dplyr operations (“verbs”) to DuckDB’s relational query processing engine. Apart from some naming confusion, there is a mostly straightforward mapping between dplyr’s verbs such as select, filter, summarise, etc. and DuckDB’s project, filter and aggregate operators. A crucial difference from previous approaches is that duckplyr does not go through DuckDB’s SQL interface to create query plans. Instead, duckplyr uses DuckDB’s so-called “relational” API to directly construct logical query plans. This API allows to bypass the SQL parser entirely, greatly reducing the difficulty in operator, identifier, constant, and table name escaping that plagues other approaches such as dbplyr.
We have exposed the C++-level relational API to R, so that it is possible to directly construct DuckDB query plans from R. This low-level API is not meant to be used directly, but it is used by duckplyr to transform the dplyr verbs to the DuckDB relational API and thus to query plans. Here is an example:
library("duckplyr")
as_duckplyr_df(data.frame(n=1:10)) |>
    mutate(m=n+1) |>
    filter (m > 5) |>
    count() |>
    explain()
┌───────────────────────────┐
│         PROJECTION        │
│   ─ ─ ─ ─ ─ ─ ─ ─ ─ ─ ─   │
│             n             │
└─────────────┬─────────────┘
┌─────────────┴─────────────┐
│    UNGROUPED_AGGREGATE    │
│   ─ ─ ─ ─ ─ ─ ─ ─ ─ ─ ─   │
│        count_star()       │
└─────────────┬─────────────┘
┌─────────────┴─────────────┐
│           FILTER          │
│   ─ ─ ─ ─ ─ ─ ─ ─ ─ ─ ─   │
│(+(CAST(n AS DOUBLE), 1.0) │
│           > 5.0)          │
│   ─ ─ ─ ─ ─ ─ ─ ─ ─ ─ ─   │
│           EC: 10          │
└─────────────┬─────────────┘
┌─────────────┴─────────────┐
│     R_DATAFRAME_SCAN      │
│   ─ ─ ─ ─ ─ ─ ─ ─ ─ ─ ─   │
│         data.frame        │
│   ─ ─ ─ ─ ─ ─ ─ ─ ─ ─ ─   │
│             n             │
│   ─ ─ ─ ─ ─ ─ ─ ─ ─ ─ ─   │
│           EC: 10          │
└───────────────────────────┘
We can see how a sequence of dplyr verbs mutate, filter, and count is “magically” transformed into a DuckDB query plan consisting of a scan, a filter, projections and an aggregate. We can see at the very bottom an R_DATAFRAME_SCAN operator is added. This operator directly reads an R data frame as if it were a table in DuckDB, without requiring actual data import. The new verb explain() causes DuckDB’s logical query plan to be printed so that we can expect what DuckDB intends to execute based on the duckplyr sequence of verbs.
Expressions
An often overlooked yet crucial component of data transformations are so-called expressions. Expressions are (conceptually) scalar transformations of constants and columns from the data that can be used to for example produce derived columns or to transform actual column values to boolean values to be used in filters. For example, one might write an expression like (amount - discount) * tax to compute the actual invoiced amount without that amount actually being stored in a column or use an expression like value > 42 in a filter expression to remove all rows where the value is less than or equal to 42. Dplyr relies on the base R engine to evaluate expressions with some minor modifications to resolve variable names to columns in the input data. When moving evaluation of expressions over to DuckDB, the process becomes a little bit more involved. DuckDB has its own and independent expression system consisting of a built-in set of functions (e.g., min), scalar values and types. To transform R expressions into DuckDB expressions, we use an interesting R feature to capture un-evaluated abstract syntax trees from function arguments. By traversing the tree, we can transform R scalar values into DuckDB scalar values, R function calls into DuckDB function calls, and R-level variable references into DuckDB column references. It should be clear that this transformation cannot be perfect: There are functions in R that DuckDB simply does not support, for example those coming from the myriad of contributed packages. While we are working on expanding the set of supported expressions, there will always be some that cannot be translated. However, in the case of non-translatable expressions, we would still be able to return a result to the user. To achieve this, we have implemented a transparent fall-back mechanism that uses the existing R-level expression evaluation method in the case that an expression cannot be translated to DuckDB’s expression language. For example, the following transformation m = n + 1 can be translated:
as_duckplyr_df(data.frame(n=1:10)) |>
    mutate(m=n+1) |>
    explain()
┌───────────────────────────┐
│         PROJECTION        │
│   ─ ─ ─ ─ ─ ─ ─ ─ ─ ─ ─   │
│             n             │
│             m             │
└─────────────┬─────────────┘
┌─────────────┴─────────────┐
│     R_DATAFRAME_SCAN      │
│   ─ ─ ─ ─ ─ ─ ─ ─ ─ ─ ─   │
│         data.frame        │
│   ─ ─ ─ ─ ─ ─ ─ ─ ─ ─ ─   │
│             n             │
│   ─ ─ ─ ─ ─ ─ ─ ─ ─ ─ ─   │
│           EC: 10          │
└───────────────────────────┘
While the following transformation using an inline lambda function cannot (yet):
as_duckplyr_df(data.frame(n=1:10)) |>
    mutate(m=(\(x) x+1)(n)) |>
    explain()
┌───────────────────────────┐
│     R_DATAFRAME_SCAN      │
│   ─ ─ ─ ─ ─ ─ ─ ─ ─ ─ ─   │
│         data.frame        │
│   ─ ─ ─ ─ ─ ─ ─ ─ ─ ─ ─   │
│             n             │
│             m             │
│   ─ ─ ─ ─ ─ ─ ─ ─ ─ ─ ─   │
│           EC: 10          │
└───────────────────────────┘
It is a little hard to see (and we are working on improving this), the explain() output clearly differs between the two mutate expressions. In the first case, DuckDB computes the + 1 as part of the projection operator, in the second case, the translation failed and a fallback was used, leading to the computation happening in the R engine. The upside of automatic fallback is that things “just work”. The downside is that there will usually be a performance hit from the fallback due to – for example – the lack of automatic parallelization. We are planning to add a debug mode where users can inspect the translation process and get insight into why translations fail.
Eager vs. Lazy Materialization
Dplyr and Pandas follow an execution strategy known as “eager materialization”. Every time an operation is invoked on a data frame, this operation is immediately executed and the result created in memory. This can be problematic. Consider the following example, a ten million row dataset is modified by adding 1 to a column. Then, the top_n operation is invoked to retrieve the first ten rows only. Because of eager materialization, the addition operation is executed on ten million rows, the result is created in memory, only for almost all of it to be thrown away immediately because only the first ten rows were requested. Duckplyr solves this problem by using a so-called “lazy materialization” strategy where no action is performed initially but instead the users’ intent is being captured. This means that the addition of one to ten million rows will not be performed immediately. The system is instead able to optimize the requested computation and will only perform the addition on the first few rows. Also importantly, the intermediate result of the addition is never actually created in memory, greatly reducing the memory pressure.
However, lazy computation presents a possible integration issue: The result of lazy computation has to be some sort of lazy computation placeholder object, that can be passed to another lazy operation or forced to be evaluated, e.g., via a special print method. However, this would break backwards compatibility with dplyr, where the result of each dplyr operation is a fully materialized data frame itself. This means that those results can be directly passed on to downstream operations like plotting without the plotting package having to be aware of the “lazyness” of the duckplyr result object. To address this, we have creatively used a R feature known as ALTREP. ALTREP allows R objects to have different in-memory representations, and for custom code to be executed whenever those objects are accessed. Duckplyr results are lazy placeholder objects, yes, but they appear to be bog-standard R data frames at the same time. R data frames are essentially named lists of typed vectors with a special row.names attribute. Because DuckDB’s lazy query planning already knows the names and types of the resulting table, we can export the names into the lazy data frame. We do not however know the number of rows nor their contents yet. We therefore make both the actual data vectors and the row names vector that contains the data frame length lazy vectors. Those vectors carry a callback that the R engine will invoke whenever downstream code – e.g., plotting code – touches those vectors. The callback will actually trigger computation of the entire pipeline and transformation of the result to a R data frame. Duckplyr’s own operations will refrain from touching those vectors, they instead continue lazily using a special lazy computation object that is also stored in the lazy data frame. This method allows duckplyr to be both lazy and not at the same time, which allows full drop-in replacement with the eagerly evaluated dplyr while keeping the lazy evaluation that is crucial for DuckDB to be able to do a full-query optimization of the various transformation steps.
Here is an example of the duality of the result of duckplyr operations using R’s inspect() method:
dd <- as_duckplyr_df(data.frame(n=1:10)) |> mutate(m=n+1)
.Internal(inspect(dd))
@12daad988 19 VECSXP g0c2 [OBJ,REF(2),ATT] (len=2, tl=0)
  @13e0c9d60 13 INTSXP g0c0 [REF(4)] DUCKDB_ALTREP_REL_VECTOR n (INTEGER)
  @13e0ca1c0 14 REALSXP g0c0 [REF(4)] DUCKDB_ALTREP_REL_VECTOR m (DOUBLE)
ATTRIB:
  @12817a838 02 LISTSXP g0c0 [REF(1)]
    TAG: @13d80d420 01 SYMSXP g1c0 [MARK,REF(65535),LCK,gp=0x4000] "names" (has value)
    @12daada08 16 STRSXP g0c2 [REF(65535)] (len=2, tl=0)
      @13d852ef0 09 CHARSXP g1c1 [MARK,REF(553),gp=0x61] [ASCII] [cached] "n"
      @13e086338 09 CHARSXP g1c1 [MARK,REF(150),gp=0x61] [ASCII] [cached] "m"
    TAG: @13d80d9d0 01 SYMSXP g1c0 [MARK,REF(56009),LCK,gp=0x4000] "class" (has value)
    @12da9e208 16 STRSXP g0c2 [REF(65535)] (len=2, tl=0)
      @11ff15708 09 CHARSXP g0c2 [MARK,REF(423),gp=0x60] [ASCII] [cached] "duckplyr_df"
      @13d892308 09 CHARSXP g1c2 [MARK,REF(1513),gp=0x61,ATT] [ASCII] [cached] "data.frame"
    TAG: @13d80d1f0 01 SYMSXP g1c0 [MARK,REF(65535),LCK,gp=0x4000] "row.names" (has value)
    @13e0c9970 13 INTSXP g0c0 [REF(65535)] DUCKDB_ALTREP_REL_ROWNAMES
We can see that the internal structure of the data frame indeed reflects a data frame, but we can also see the special vectors DUCKDB_ALTREP_REL_VECTOR that hide the un-evaluated data vectors as well as DUCKDB_ALTREP_REL_ROWNAMES that hide the fact that the true dimensions of the data frame are not yet known.
Benchmark: TPC-H Q1
Let’s finish with a quick demonstration of duckplyr’s performance improvements. We use the data generator from the well known TPC-H benchmark, which is helpfully available as a DuckDB extension. With the “scale factor” of 1, the following DuckDB/R one-liner will generate a data set with a little over 6 million rows and store it in the R data frame named “lineitem”:
lineitem <- duckdb:::sql("INSTALL tpch; LOAD tpch; CALL dbgen(sf=1); FROM lineitem;")
We have transformed the TPC-H benchmark query 1 from its original SQL formulation to dplyr syntax:
tpch_01 <- function() {
  lineitem |>
    select(l_shipdate, l_returnflag, l_linestatus, l_quantity, l_extendedprice, l_discount, l_tax) |>
    filter(l_shipdate <= !!as.Date("1998-09-02")) |>
    select(l_returnflag, l_linestatus, l_quantity, l_extendedprice, l_discount, l_tax) |>
    summarise(
      sum_qty = sum(l_quantity),
      sum_base_price = sum(l_extendedprice),
      sum_disc_price = sum(l_extendedprice * (1 - l_discount)),
      sum_charge = sum(l_extendedprice * (1 - l_discount) * (1 + l_tax)),
      avg_qty = mean(l_quantity),
      avg_price = mean(l_extendedprice),
      avg_disc = mean(l_discount),
      count_order = n(),
      .by = c(l_returnflag, l_linestatus)
    ) |>
    arrange(l_returnflag, l_linestatus)
}
We can now execute this function with both dplyr and duckplyr and observe the time required to compute the result. "Stock" dplyr takes ca. 400 milliseconds on my MacBook for this query, duckplyr requires only ca 70 milliseconds. Again, this time includes all the magic transforming the sequence of dplyr verbs into a relational operator tree, optimizing said tree, converting the input R data frame into a DuckDB intermediate on-the-fly, and transforming the (admittedly small) result back to a R data frame. Of course, the data set used here is still relatively small and the query is not that complex either, essentially a single grouped aggregation. The differences will be much more pronounced for more complex transformations on larger data sets. duckplyr can also directly access large collections of e.g., Parquet files on storage, and push down filters into those scans, which can also greatly improve performance.
Conclusion
The duckplyr package for R wraps DuckDB's state-of-the-art analytical query processing techniques in a dplyr-compatible API. We have gone to great lengths to ensure compatibility despite switching execution paradigms from eager to lazy and having to translate expressions to a different environment. We continue to work to expand duckplyr's capabilities but would love to hear your experiences trying it out.
Here are two recordings from last year's posit::conf where we present DuckDB for R and duckplyr:

