Using DuckDB in Streamlit
TL;DR: We use a real-world railway dataset to demonstrate the integration of DuckDB and Streamlit, including the database connection management, the DuckDB Python relational API and responsiveness in interactive map charts.
Introduction
In the article Analyzing Railway Traffic in the Netherlands, Gábor has shown how to analyze data with SQL and reading remote files with DuckDB, by using open data from the Rijden de Treinen (Are the trains running?) application.
Using the above open data, in this post we will build an application, in which a user can:
- Understand the railway traffic data;
- Visualize the railway network traffic in 2024, by using Plotly;
- Visualize the five closest train stations on any point selected on the map, by using the Streamlit Folium component.
The application will be developed with Streamlit, an open source framework in which one can implement data applications easily with Python. The application code is available on GitHub.
Connecting to DuckDB in Streamlit
To load the railway traffic data, we write a function, which creates the two tables we will be working with, services and stations:
def prepare_duckdb(duckdb_conn):

    duckdb_conn.sql("""
        create table if not exists services as
        from 'https://blobs.duckdb.org/nl-railway/services-2024.csv.gz'
    """)

    duckdb_conn.sql("""
        create table if not exists stations as
        from 'https://blobs.duckdb.org/nl-railway/stations-2023-09.csv'
    """)
From a Streamlit application there are three ways to connect to DuckDB:
- In-memory connection;
- Persisted local file connection;
- Attaching an external database.
In-Memory Connection
Connecting to an in-memory database involves loading the data into memory, whenever a DuckDB connection is established. Depending on the resources of the application server and the amount of data, creating a new in-memory DuckDB connection and loading the required data on every request will slow down the application. In Streamlit this behavior is addressed by caching the resource, which can be done as:
- caching the DuckDB connection as a global shared connection in the application;
- caching the DuckDB connection for the user session.
@st.cache_resource(ttl=datetime.timedelta(hours=1), max_entries=2)
def get_duckdb_memory(session_id):
    """
    Set a caching resource which will be refreshed
     - either at each hour
     - either at each third call
     - either when the connection is established for a new session_id
    """

    duckdb_conn = duckdb.connect()
    prepare_duckdb(duckdb_conn=duckdb_conn)

    return duckdb_conn
Persisted Local File Connection
A DuckDB connection can be established against a persisted database file on the server of the application. The database file can be created:
- during the deployment, before the application starts;
- a standalone process, which creates the database and copies it to the application server. Depending on the freshness requirement of the application, one might schedule a process to refresh the data.
duckdb_conn = duckdb.connect(
    "train_stations_and_services.duckdb",
    read_only=True
)
Attaching an External Database
Another way to connect to DuckDB is to establish a read only connection to an instance over HTTPS or S3 compatible APIs,
e.g., DUCKDB_EXTERNAL_LOCATION = "https://blobs.duckdb.org/nl-railway/train_stations_and_services.duckdb":
duckdb_conn = duckdb.connect()
duckdb_conn.execute(f"attach '{DUCKDB_EXTERNAL_LOCATION}' as ext_db")
duckdb_conn.execute("use ext_db")
More details about attaching an external database can be found in the DuckDB documentation.
Considerations
- DuckDB works best if you have allocated 1-4GB of memory per thread, therefore configure the appropriate resources when deploying the Streamlit application.
- The recommendation is to use a new connection for each database interaction or at least one at user session level, and not a global connection at application level. Using a global connection might result in unexpected behaviour, depending on the number of users using the application at the same time.
- When using a persisted local database, take into account that when there is a database connection established no other process can write to it. One workaround is to have a process which creates and replaces the database file on the server.
- When using an attached database, take into account that the application can have a performance impact depending on the storage solution chosen.
Starting from this point, we will work with the external database.
Analyzing Dutch Railway Data
To analyze the data within Streamlit, we will make use of the Python relational API, by chaining queries. We start by defining a relation, which will select the needed data from stations:
stations_selection = duckdb_conn.sql("""
    select name_long as station_name, geo_lat, geo_lng, code
    from stations
""").set_alias("stations_selection")
Then we define a relation for the services selection:
services_selection = (
    duckdb_conn.sql("from services")
    .aggregate("""
        station_code: "Stop:Station code",
        service_date: "Service:Date",
        service_date_format: strftime(service_date, '%d-%b (%A)'),
        num_services: count(*)
    """)
    .set_alias("services")
)
We then join the two relations to select the station name, the geolocation and other details we will be using further, bringing the above code together in a function.
def get_stations_services_query(duckdb_conn):

    # create a relation for the station selection
    stations_selection = ...

    # create a relation for the services selection
    services_selection = ...

    # return the query and the duckdb_conn
    return (
        stations_selection
        .join(
            services_selection,
            "services.station_code = stations_selection.code"
        )
        .select("""
            service_date,
            service_date_format,
            station_name,
            geo_lat,
            geo_lng,
            num_services
        """)
    ), duckdb_conn
When we run get_stations_services_query(get_duckdb_conn()), there is yet no data retrieved from the database. This is because the query evaluation is lazy, which means that the query is not executed against the database until an execution command is encountered.
The query will be executed when one of the following methods is encountered:
stations_query.df()to extract to a Pandas dataframe;stations_query.fetchall()to extract in a list;stations_query.write_to()to export the data in a file;- any other calculation method, such as
.sum,.row_numberetc. The relational methods can be found in the DuckDB documentation.
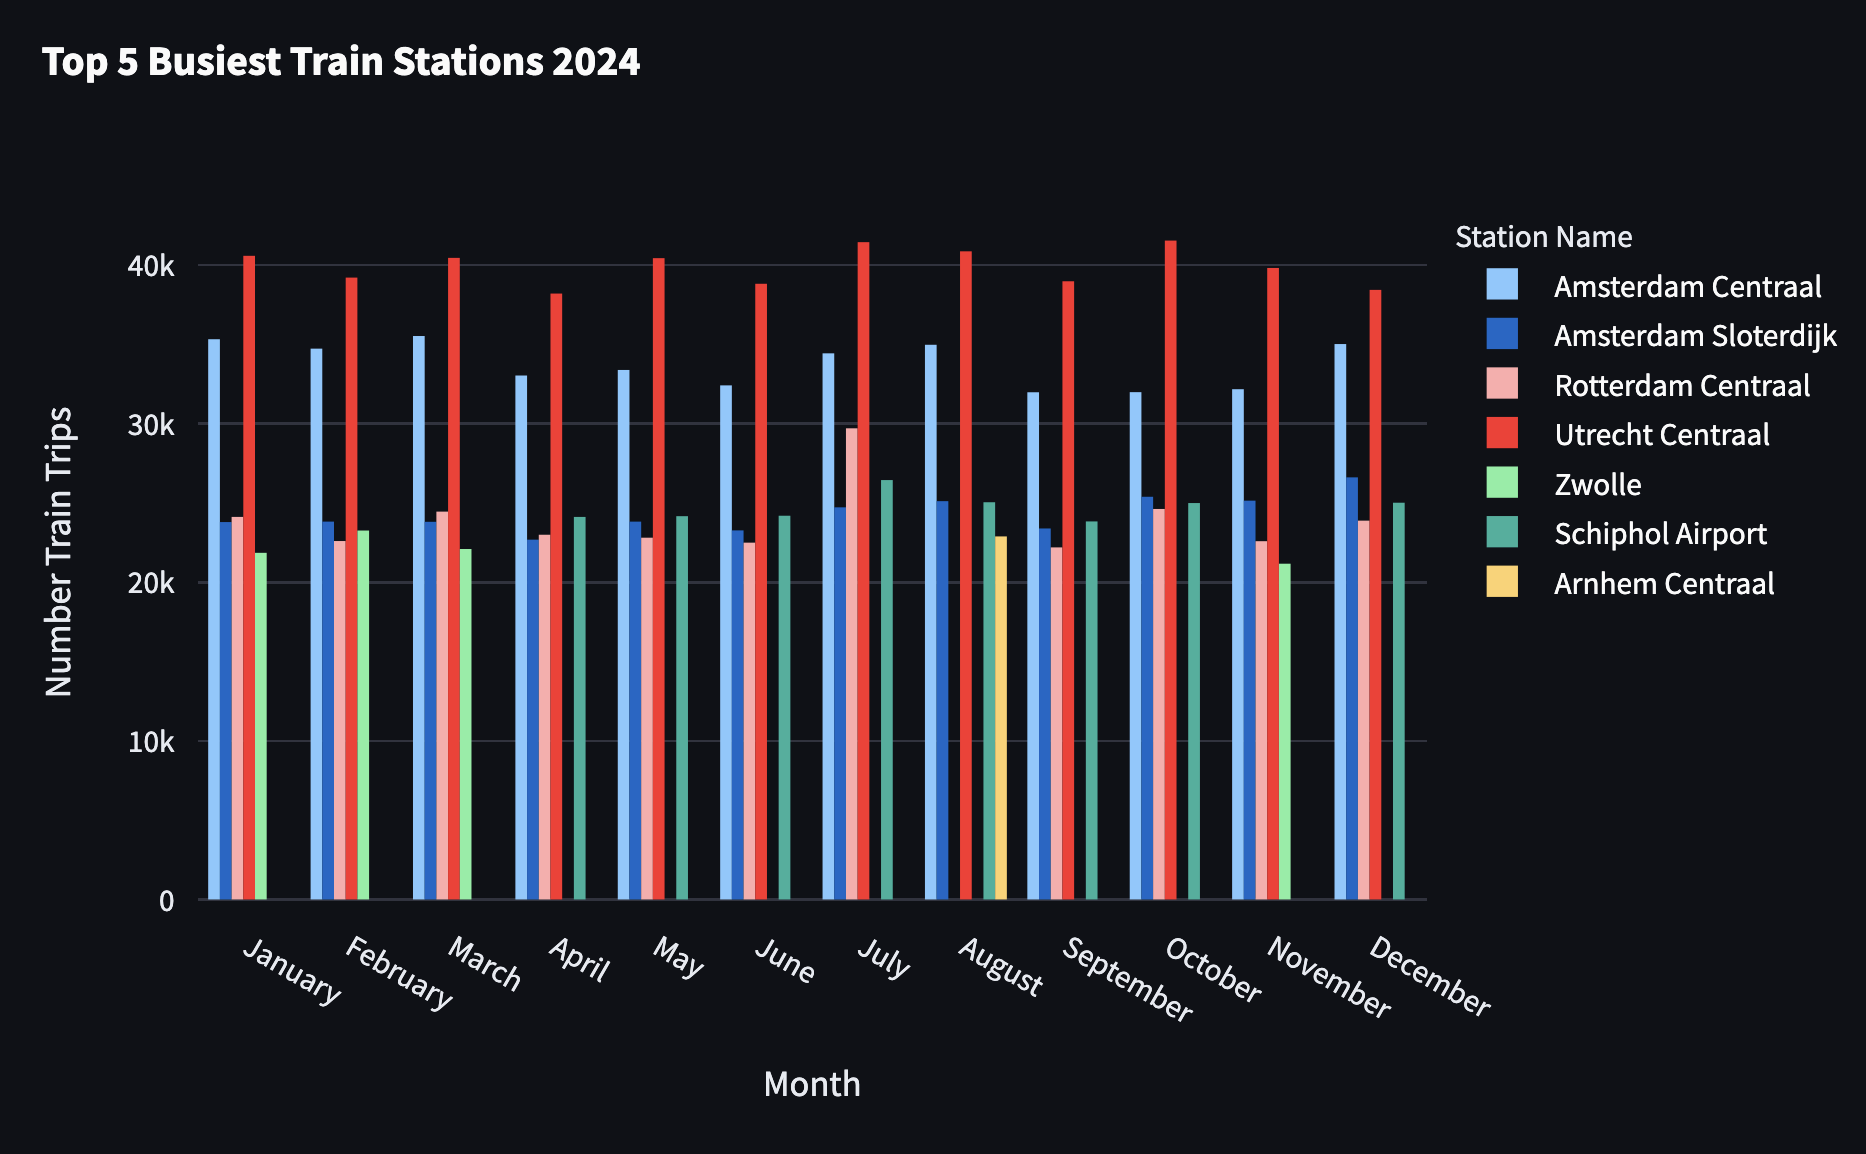
Top 5 Busiest Train Stations per Month
To extract the 5 busiest train stations per month, we start from the above query and add a row_number calculation with a final filter of the ranking to be less or equal to 5:
stations_query, _ = get_stations_services_query(get_duckdb_conn())

top_5_query = (
    stations_query.aggregate("""
            station_name,
            service_month: monthname(service_date),
            service_month_id: month(service_date),
            num_services: sum(num_services)
        """)
    .select("""
            station_name,
            service_month,
            service_month_id,
            num_services,
            rn: row_number()
                over (
                    partition by service_month
                    order by num_services desc
                )
        """)
    .filter("rn <= 5")
    .order("service_month_id, station_name")
)
Streamlit provides a series of charts, such as line and bar, but, unfortunately, they do not offer many personalization possibilities. Therefore, the above chart was generated with Plotly, an open source graphing library, integrated with Streamlit by calling st.plotly_chart.
Railway Network Utilization Analysis
The data about the train rides through the train stations of The Netherlands, at day level, is a perfect input for analyzing the utilization of the railway network across the country and during the year.
Railway Network Utilization across the Country
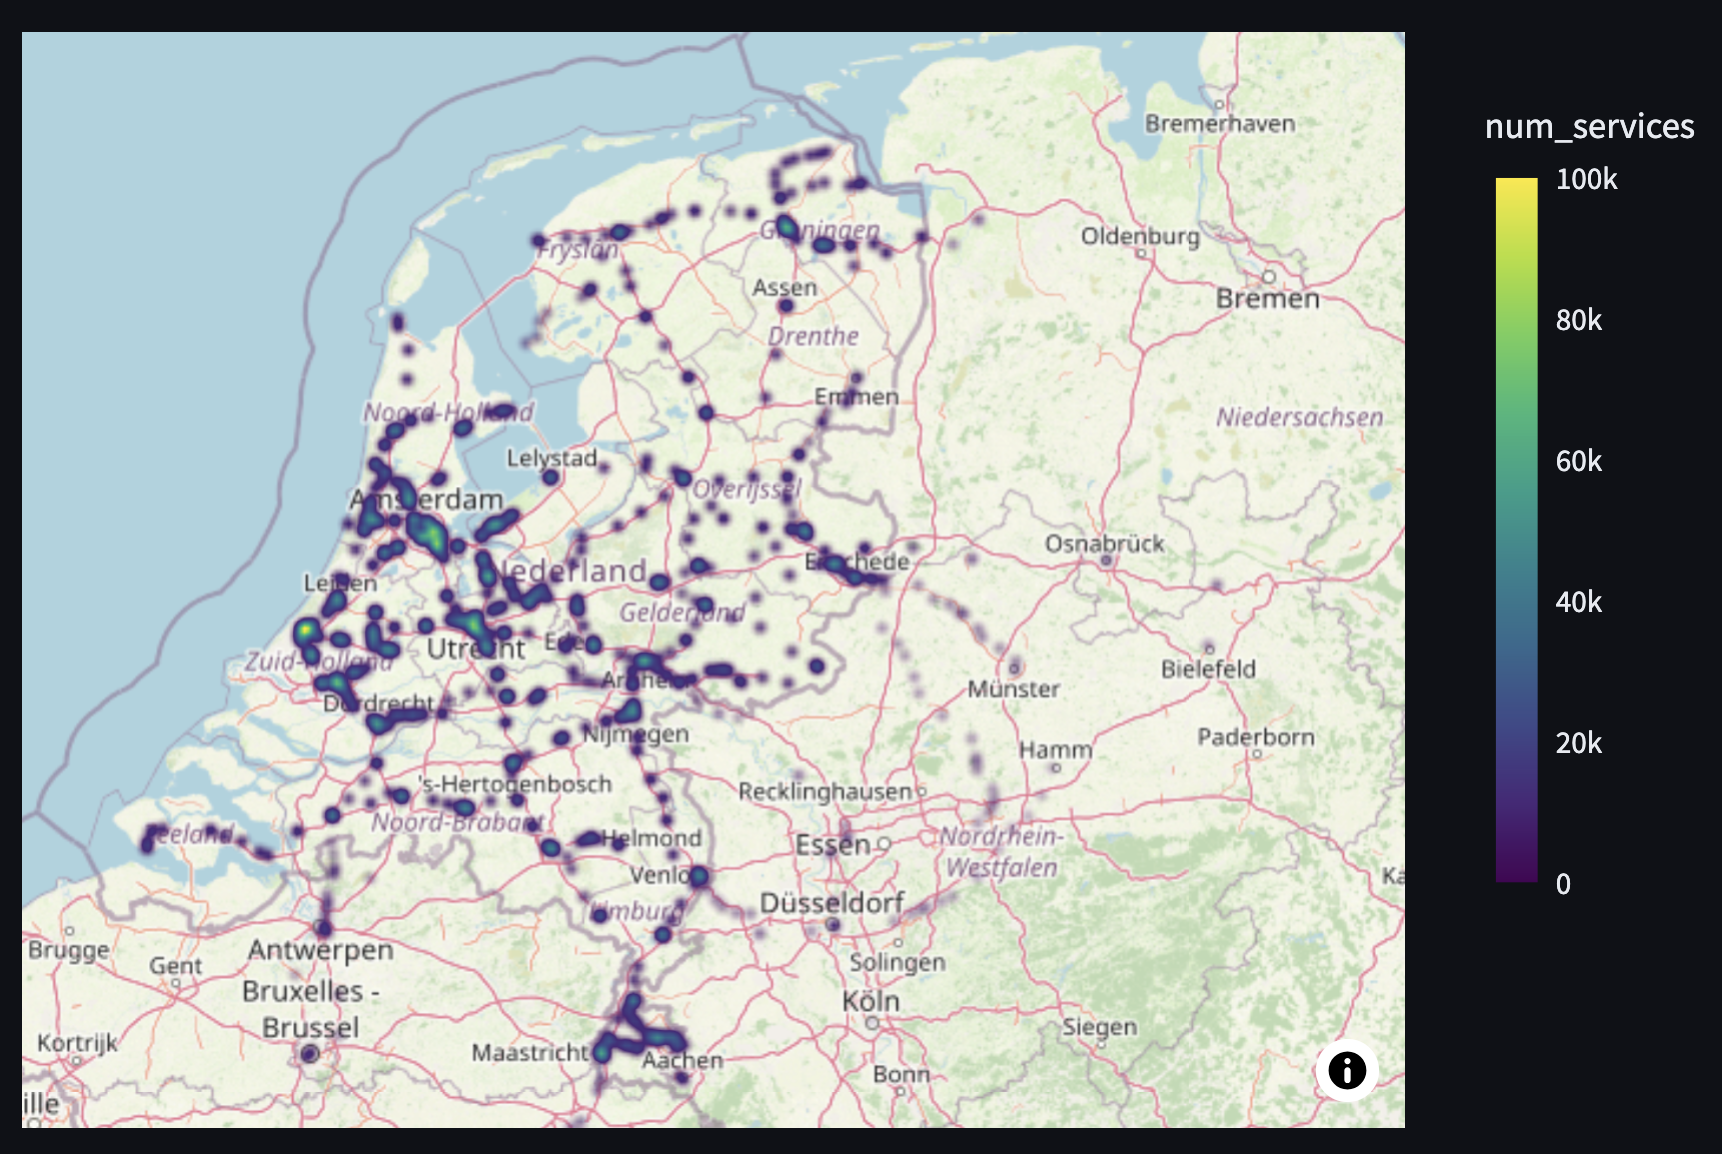
To analyze the network utilization across the country, we use density_map chart from Plotly, which will generate a heat map on a map chart. Because heat maps work best with pre-aggregated data, we first aggregate the number of train services and the geolocation of the station:
stations_df = stations_query.aggregate(
    "geo_lat, geo_lng, num_services: sum(num_services)"
).df()
It is interesting to observe that the north-east of the country is barely covered by railway and that, while Groningen and The Hague appear to be used during the year, neither of their train stations was in the top 5 busiest train stations per month.
Animating the Heat Map
From the above static chart, we can easily generate an animation with Plotly, by providing the animation frame parameter. In our case, we generate an animation with the railway network utilization at service day level during July 2024:
Railway Network Utilization during the Year
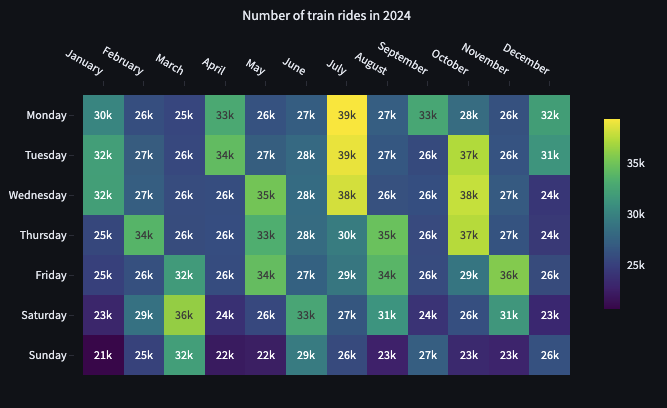
From a year point of view, we are curious to discover how busy the network is in each month and each day of the week, which is better displayed through a heat map. We prepare the input for the chart, by pivoting the number of services by the month name of the service date and by grouping by the ISO day name of the week. At the moment, there is no pivot method in the Python relational API, but we can use the SQL query generated by the relational API as source in the pivot raw SQL:
@st.cache_data(ttl=3600, max_entries=100)

def get_stations_services_data(_duckdb_conn):
    query = _duckdb_conn.sql("from services").aggregate("""
            service_day: dayname("Service:Date"),
            service_day_isodow: isodow("Service:Date"),
            service_month: monthname("Service:Date"),
            num_services: count(distinct "Service:RDT-ID")
        """)

    return (
        _duckdb_conn.sql(f"""
            pivot ({query.sql_query()})
            on service_month
            using sum(num_services)
            group by service_day, service_day_isodow
            order by service_day_isodow
        """)
        .select(
            "January",
            "February",
            "March",
            "April",
            "May",
            "June",
            "July",
            "August",
            "September",
            "October",
            "November",
            "December",
            "service_day",
        )
        .df()
    )
We have decided to create a function, in order to highlight cache_data functionality in Streamlit. While the above query is executed in 300 ms on a MacBook Pro with 12 GB memory, we want to cache the results because the result of the query does not change often. cache_data is used in Streamlit to cache the results of a function and just as cache_resource, it has the attributes time to live and max entries. The two caching mechanisms require that the input parameters passed to the function to be hashable. Since the DuckDB connection object is not hashable, we can tell Streamlit to ignore it by adding the prefix _.
It is important to notice that the order of columns and values matters in a heat map chart and that we need to reset the index of the pivoted data before plotting.
The code of implementing interactive maps with Plotly in Streamlit is available on GitHub.
Finding the Closest 5 Stations with Folium
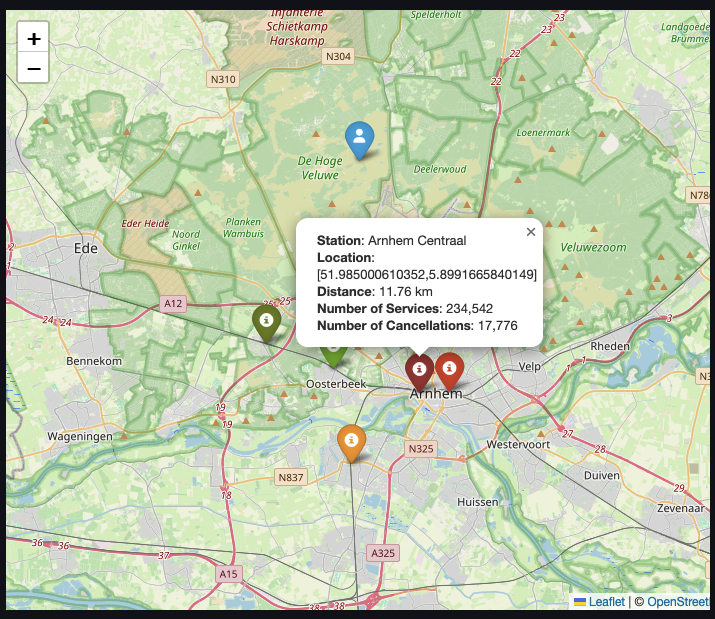
One other use-case for the railway network data is to find the closest train stations to a location selected by the user on the map. While Streamlit and Plotly have the functionality to register click events on the chart, they work only when the user is selecting points which are part of the chart data. Therefore, we will use streamlit-folium, a Streamlit component wrapped around Folium, which can register the clicks on any point of the map.
To work with geo data in DuckDB we have to install and load the spatial extension:
duckdb_conn.sql("install spatial;")
duckdb_conn.sql("load spatial;")
We then define a function to retrieve the query, which returns the closest five train stations to a location, composed of latitude and longitude.
def get_closest_stations_query(duckdb_conn, lat, lng):

    stations_selection = duckdb_conn.sql("""
        select name_long as station_name, geo_lat, geo_lng, code
        from stations st
        where exists (
                select count(*)
                from services sv
                where st.code = sv."Stop:Station code"
                having count(*) > 100
            )
    """)

    return (
        stations_selection.project(f"""
            code as station_code,
            station_name,
            geo_lat,
            geo_lng,
            station_geo_point: st_point(geo_lng, geo_lat),
            clicked_geo_point: st_point({lng}, {lat}),
            distance_in_m: st_distance_sphere(
                            st_point(geo_lng, geo_lat),
                            clicked_geo_point
                        ),
            distance_in_km: round(distance_in_m/1000,2)
        """)
        .order("distance_in_km")
        .limit(5)
    )
In the above query we use st_point to create a point type field and st_distance_sphere to get the distance, in meters, between two points.
It is important to mention that while we usually refer to a geo point as
[latitude, longitude], when working with spatial extensions we usually create the point as[longitude, latitude]. This applies to PostGIS as well.
When a user clicks on the map, we store the clicks in the session state and rerun Streamlit to display the map with the new user selection. When rerun happens, Streamlit will rerun the entire application for the current session, therefore understanding the session state and caching mechanisms is essential when building Streamlit applications.
The code of implementing interactive maps with Folium in Streamlit is available on GitHub.
Conclusion
In this post, we illustrated how DuckDB can be used in Streamlit, how the Python relational API can make our code cleaner by chaining queries and how to implement interactive maps with Plotly and Folium, while leveraging the Streamlit caching mechanism.

